Dashboards: Earning and spending widget
The Earning and spending widget shows all of your earnings and spending over a selected date range. It offers high levels of customisation so you can tailor the widget to your preference!
In this article
The Earning and spending banner widget
You can add the Earning and spending widget as a banner widget:

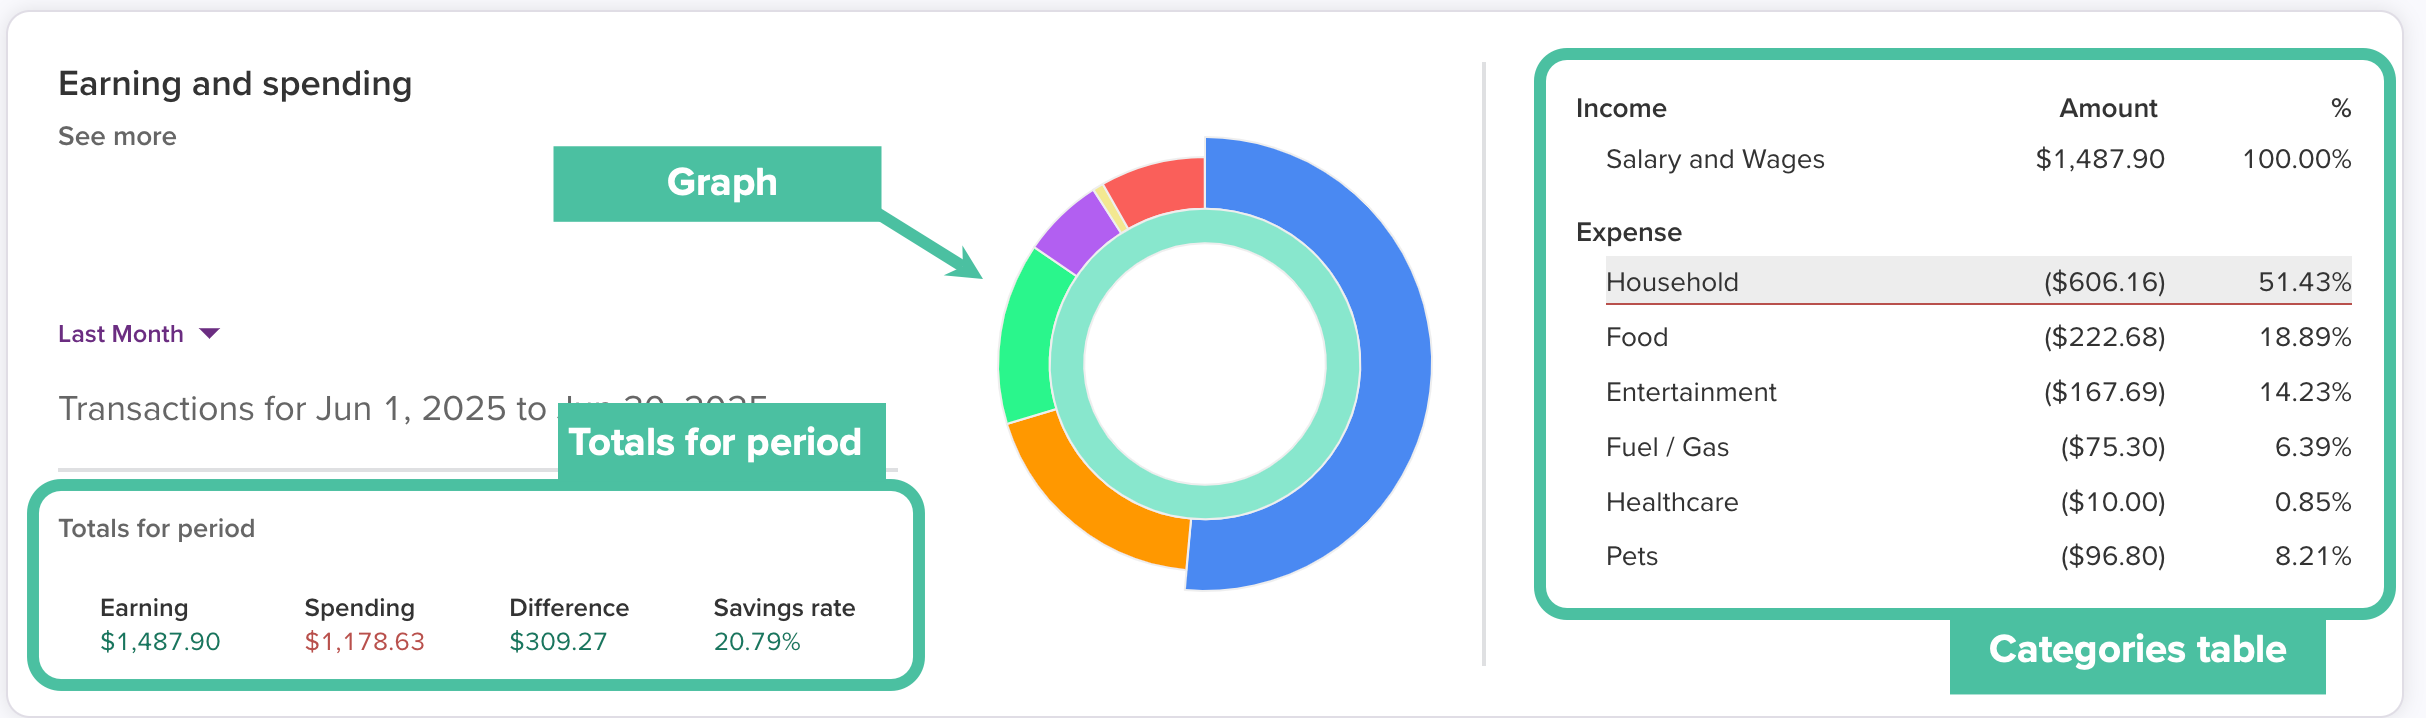
The Earning and spending column widget
You can also add the Earning and spending widget as a column widget:

Configuring the Earning and spending widget
The Earning and spending widget is highly customisable, allowing you to pick and choose the information you would like reflected.

Configuration options for the Earning and spending widget:
-
Custom widget title (optional)
Replaces the default 'Earning and spending' title with a name of your choosing
-
Source
Choose Transactions to reflect actual earning and spending, or Budgets to display budgeted earning and spending.
-
Get transactions using (only available when using Transactions as the source)
Allows you to configure the widget using Filter options configured in the widget's settings or a Saved search that you have already set up.
-
View options
Choose to show or hide the totals for period, graph, categories table:
-
What transaction data do you want to see?
Choose to see only earning, only spending, or both earning and spending data
-
Extra options
Choose to Roll up sub-categories into parent category (see earning and spending at the parent category level), Include uncategorized transactions, and/or Include transfers
-
Chart sorting behaviour
Choose to sort the graph by category order (as it appears on your categories page) or by segment size
-
Account filtering
Choose no account filtering to show all accounts, limit to selected account types, or limit to selected accounts. For selected accounts, drag and drop the accounts you'd like to display over to the Selected accounts column.
-
Include or exclude specific categories
Choose to either include or exclude specific categories.

Custom reports using the Earning and spending widgets
The Earning and spending widgets have a high level of customisation, allowing you to view specific accounts, categories, or Saved search results.
Create different versions of the widget to show and compare certain views you might be interested in. For some ideas of how you might like to use this widget, have a look below!
Including the categories table:
A top tip is to include the categories table in your widget configuration to easily see your earning and spending broken down:

Compare different accounts or categories:
The example below is to help separate Fixed expense category spending from Discretionary expense category spending, but other use-cases include configuring these widgets to separate Joint and Personal accounts and/or categories or Business and Personal.

Comparing different timeframes:
Another great way to use these widgets is to compare different timeframes! From how you are tracking this month compared to last, or year by year:

How can I view sub-categories instead of parent categories on the Earning & Spending widget (or vice versa)?
To report at the sub-category level on the Earning and Spending widget, untick the option to Roll up sub-categories into parent category under the widget’s settings:

If you’d prefer to see reporting at the parent category level, then just ensure the option to Roll up sub-categories into parent category is ticked instead ✅
See: Configuring individual widget settings for more details on editing widget settings.
How is the category percentage calculated?
The percentage shown beneath the Earning and spending widget graph represents the percentage of that category compared to the total spend for the categories configured in the widget over the selected period.
For example, the widget below left is configured to only show the Rent and Pets category spending for 2025. This calculates Rent as being 73.76% of the total spent for just these two configured categories in 2025.
Whereas the widget on the right below is configured to show all categories for 2025. As such, Rent accounts for 38.08% of total spending across all categories in 2025.
